
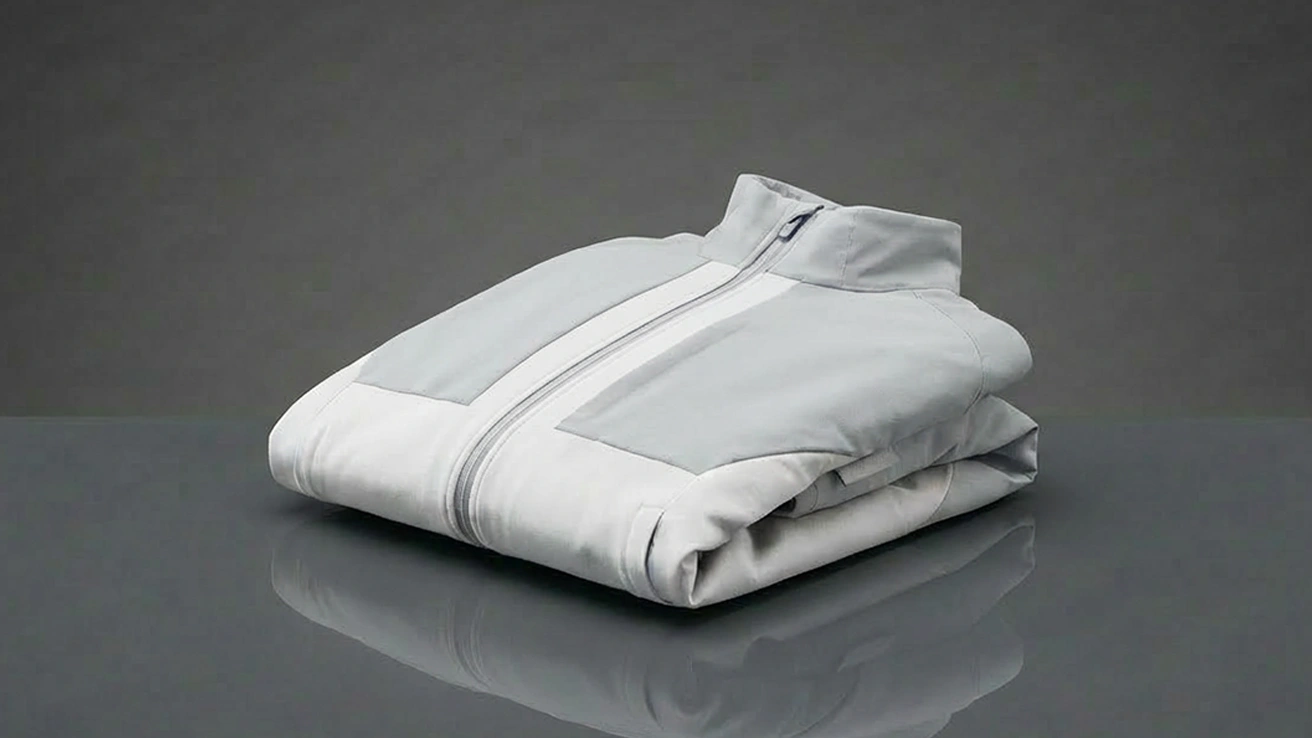
Data-driven opening: what the numbers reveal and how materials feel
The tally matters: life-cycle energy and water footprints shift depending on fiber, binder, and finish — and the differences are tangible when you hold the cloth. Early-stage studies and production audits highlight that choices in raw fiber, spinning, and coating change both the energy consumption index and local water stress footprint. A close-up of sample swathes — cotton that drinks, polyester that repels, blends that sit warm like stew — makes that trade-off obvious. For practical comparisons, consider the manufacturing stream for thermal insulation fabric materials where measured thermal conductivity and R-value targets collide with dye-bath volumes and drying-line hours. The sensory and numeric realities meet at the same table: a fabric’s hand, loft, and GSM tell you as much as kilowatt-hours and cubic meters of water per kilogram.
Breaking down the key indices
Energy consumption index: tally kilowatt-hours across spinning, heat-setting, lamination, and finishing. Thermal conductivity and R-value are the performance toggles; higher loft and phase-change layers can raise comfort with modest energy increases. Water-scarcity footprint: track freshwater withdrawal against regional scarcity metrics — production in drought-prone zones magnifies the environmental signal even if absolute water use stays moderate. Moisture-wicking finishes often require additional wash cycles and solvents; those steps add to both water and energy accounts. Use an audited bill-of-process to identify hotspots rather than guessing from supplier brochures.
Material choices that shift the balance
Natural fibers bring low embodied energy in raw state but can demand heavy irrigation and wet processing. Synthetics save water in field but lean on petrochemical feedstocks and heat-intensive extrusion. Hybrid approaches — recycled polyester cores with natural surface layers — can lower both water strain and energy pull if designed with efficient bonding. When you handle a finished swatch, you can often smell the finish, feel the loft, and infer the binder type; these sensory cues reliably map to process stages and their energy demands.
Operational production teardown — concrete steps and keywords
Map the process on one sheet: inbound fiber → carding → spinning → knit/weave → insulation batting insertion → coating/lamination → drying/curing → quality checks. At each node, record kWh and liters per kg. When I ran production sketches for a mid-sized mill near California during the 2021 drought, peaks in dye-bath recirculation and drying cycles were the clear drivers of water and energy spikes — a real-world anchor that altered supplier choices. Include {main_keyword} and {variation_keyword} in the teardown documents so purchasing, engineering, and sustainability teams align on the exact variables you track. Thermal conductivity testing, loft retention cycles, and solvent recovery rates are the operational metrics that tie lab results to factory meters.
Common mistakes and sensory lessons from the floor
Teams often chase a single metric — lowest kWh/kg or minimal water use — and miss cross-effects. Over-bonding insulation to hit R-value targets can trap moisture and force longer drying times. Skipping pilot runs leaves you blind to fabric flavor: too-stiff, too-flat, or oddly clammy. — I learned that a softer hand often corresponds to added finishing steps that cost energy. Simple swaps, like switching to closed-loop dye systems and optimizing curing oven dwell time, reduce both indexes without compromising warmth.
Comparative snapshot: three production paths
Path A: Natural-dominant — lower process energy, higher water burden unless treated with closed-loop systems. Path B: Synthetic-dominant — steady low-water profile, higher extrusion and finishing energy. Path C: Recycled hybrid — moderate energy with lower embodied carbon and reduced water footprint when upstream sorting is efficient. Each path shows different trade-offs in thermal conductivity, phase-change material integration, and manufacturability; choose based on regional water scarcity and local energy mix.
Three golden rules for selecting strategies
1) Prioritize hot-spot audits over blanket claims: measure kWh and liters at dye, drying, and lamination stages. 2) Match material to place: favor low-water processes in drought-prone regions and low-energy finishes where grid carbon is high. 3) Test tactilely and thermally: validate R-value, thermal conductivity, and loft retention after real production cycles — those lab-to-floor checks prevent costly rework.
These rules point toward products that balance comfort and footprint, and they explain why manufacturers who integrate audit data with sensory checks land better outcomes. For teams turning numbers into garments, the path is technical but human — and where it matters most, brands that stitch both together deliver the best results for supply chains and wearers alike. Y-Warm. —